
Anyone who follows us on social media knows that we regularly highlight the top performances of our customers and share them with dairy farmers, farm visitors, and fellow advisors. We regularly see efficiency differences of 400 to sometimes 700 liters of milk per day per AMS unit on farms with a comparable number of lactating animals. We all know that this efficiency KPI is influenced by a large number of factors. Still, in this update we want to zoom in on the factor “overstocking”, partly because on our travels we still far too often find that overstocking is seen as a miracle tool to drive AMS efficiency and margin by brute force. Nothing could be further from the truth…
About 8 years ago, research showed that milk yield per milking, milking speed, and visit frequency are the 3 most decisive factors for maximizing individual AMS efficiency. Below, based on field research figures, we try to show to what extent the management factor of overstocking influences these 3 factors.
“Highlighting the top performances of our customers.”
Milk yield per milking and milking speed.
Milk yield per milking is determined by a combination of daily production and visit frequency. Milking speed is determined by genetics, stage of lactation, and level of daily production. When comparing animals with the same visit frequency, it is therefore the animals with the highest daily production that come out on top. Daily production, in turn, besides genetics and stage of lactation, is directly driven by feed intake in relation to stage of lactation (DIM: days in milk).
Feeding activity
The chart below shows the difference in feeding activity 90 minutes after feed delivery at the feed fence, for 2 different feeding space sizes: 0.5 m/cow (20% overstocking) and 1 m/cow.
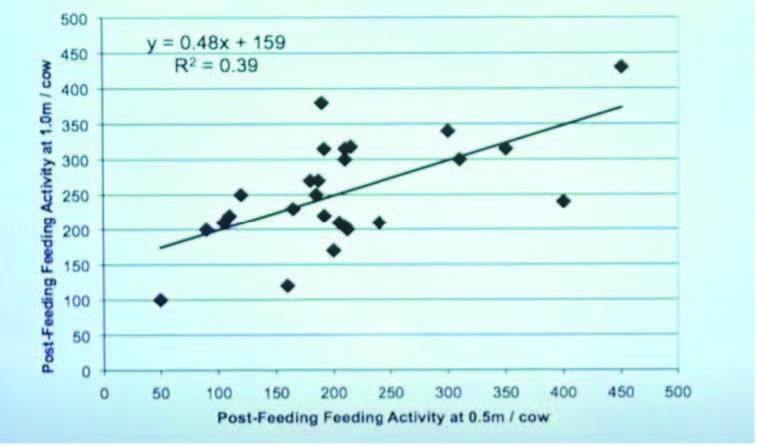
The vertical axis (y-axis) shows feeding activity in minutes per 24 hours with 1 meter of feeding space per animal. The horizontal axis (x-axis) shows the same value but with 0.5 m of feeding space per animal (20% overstocking scenario).
“Difference in feeding activity 90 minutes after feed delivery.”
Each diamond on the chart is the same lactating animal, which took part in the 0.5-meter feeding space setup and then the 1-meter feeding space setup. If you draw a line horizontally to the left from any diamond, you reach that animal's feeding activity with 1 meter of feeding space. If you draw the line downward, you find the feeding activity of the same animal with 0.5 m of feeding space. If we add the trend line (see chart), it is very clear that feeding activity per animal increases, positively correlated, as feeding space per animal increases.
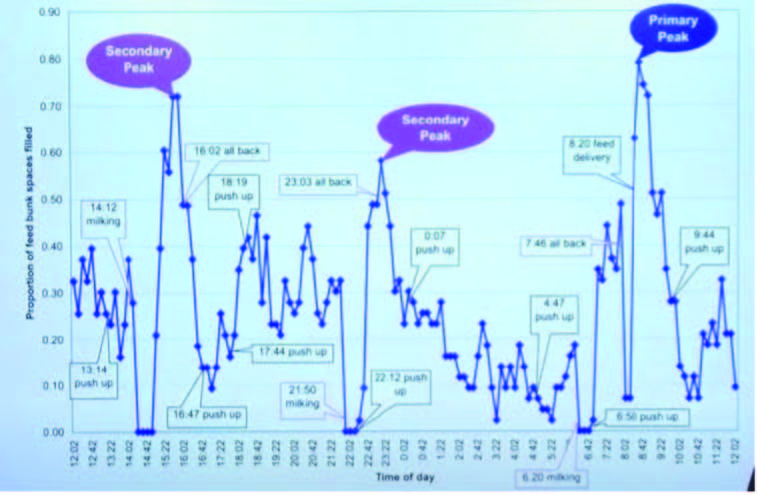
Most farmers tend to believe that the cows that cannot get to the feed fence right after feed delivery will manage once the most dominant animals are satisfied. Unfortunately, this is only partly true. Recent research shows this very clearly. Take a look at the following chart.
In the image above (chart no. 4), you see numerous cows shown as squares. (Red = 1st lactation, green = 2nd lactation, yellow = 3rd lactation or higher. These are animals housed together in 6 different mixed groups on the same dairy farm with 800 animals.) The vertical axis (y-axis) shows the predicted 305-day production of the various animals, calculated on the basis of each individual animal's first milk recording. The horizontal axis (x-axis) shows the number of days in lactation since calving for each animal.
It is undisputed (and also normal) that the 3 feed fence occupancy peaks always occur right after the cows return from the milking parlor. The animals take their place at the feed fence immediately after returning. Now look carefully at how, depending on the time of day or night, cows respond differently, and above all less intensively, to feed being pushed up. The different response in the late afternoon is partly due to the animals' circadian rhythm, but look especially at how few cows still come to the feed fence after the 2nd and later feed push-ups. Although we observe this with parlor milking in this trial, we also see it with AMS milking as soon as overstocking exceeds 107%. Cows simply like to eat in line with their circadian rhythm, and cows also like to “eat together” (herd animals). The reason cows respond less spontaneously and intensely after the 2nd push-up is that they feel uncomfortable at the feed fence when not enough herd mates are present. With AMS milking, we should therefore aim to let cows eat together as undisturbed as possible at the times their circadian rhythm encourages it, so that they reach maximum feed intake during the period of maximum feed fence occupancy. At first, you might think quite the opposite.
“The 3 feed fence occupancy peaks always occur right after returning from the milking parlor.”
With AMS milking, you can “limit” this phenomenon by keeping feed push-up intervals very short and increasing the number of push-ups to 18 to 22 times per 24 hours. Still, field research shows that from 107% overstocking, the circadian rhythm ultimately determines intake capacity, and in a negative direction. This is also why farms with very high daily production per cow are often reluctant to switch from a 2-row barn to a 3-row barn (much more feeding space per cow in a 2-row barn).
As mentioned earlier, milking speed is genetically determined, but it is also true that, on average, milking speed increases from the 2nd lactation onward. We see this clearly when reading out the AMS software. This is partly due to the widening of the teat canal, but also to the higher daily production in the 2nd lactation. To give this higher milk yield in the 2nd lactation the best possible chance, it is important that first-calf heifers reach the highest possible peak production and total lactation production in their first lactation. This brings us to the next management factor with a considerable influence on milk yield per visit, milking speed, and visit frequency, namely: “Housing first-calf heifers in a mixed group with 2nd+ lactation animals: yes or no?”
“Milking speed is genetically determined.”
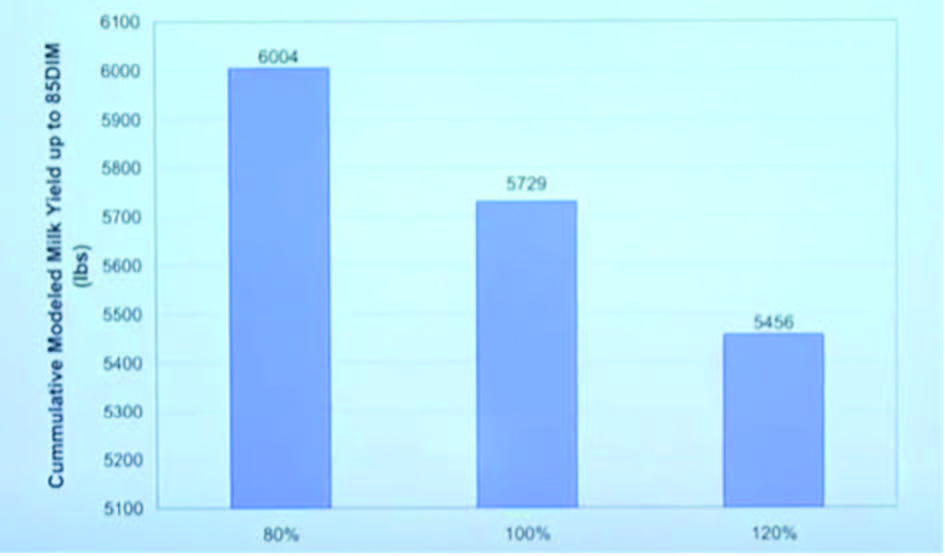
In the image above (chart no. 3), you see the total production (in lbs) of 342 first-calf heifers in the first 85 days of their lactation, which were part of a study with 3 different stocking rates (80% = 20% understocking, 100% = neither under- nor overstocking, 120% = 20% overstocking). Conclusion: with 20% overstocking, first-calf heifers housed together with 2nd+ lactation animals show an average production loss of 273 lbs = 123 liters during the first 85 days, or a loss of 1.44 liters per heifer per day. Now read that last sentence again, knowing that a heifer's production target is on average 75% of later lactations. Now calculate for yourself how much you may be “leaving on the table” with the older lactation animals when applying this “housing management”.
Within about 6 months, this study will be fully completed in the US and we will be able to share the financial picture. It is certainly not the case that later-lactation animals (2+) “close the gap”, as is sometimes wrongly claimed. The next chart removes all doubt about this.
“Within about 6 months, this study will be fully completed in the US.”
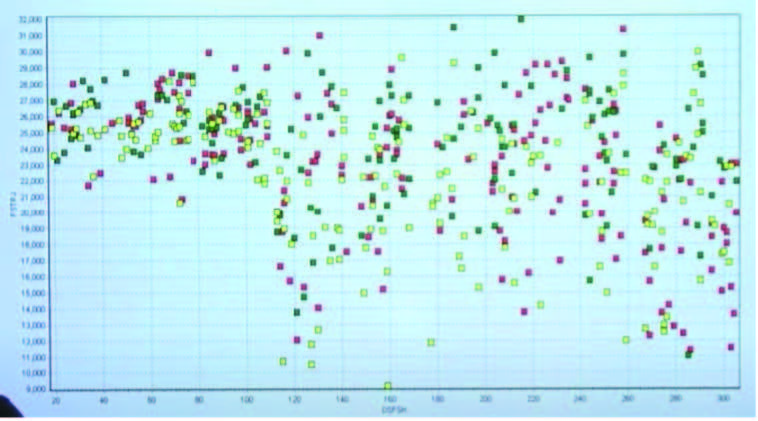
In the image above (chart no. 4), you see numerous cows shown as squares. (Red = 1st lactation, green = 2nd lactation, yellow = 3rd lactation or higher. These are animals housed together in 6 different mixed groups on the same dairy farm with 800 animals.) The vertical axis (y-axis) shows the predicted 305-day production of the various animals, calculated on the basis of each individual animal's first milk recording. The horizontal axis (x-axis) shows the number of days in lactation since calving for each animal.
Now pay close attention:
- All cows plotted to the left of 110 days since calving were given a regime of 15% UNDERstocking and 75 cm of feeding space during the close-up period, and 0% overstocking and 75 cm of feeding space from day 1 after calving.
- All cows plotted to the right of 110 days since calving were given a regime of 0% OVERstocking and 60 cm of feeding space during the close-up period, and 20% OVERstocking and 75 cm of feeding space from day 1 after calving.
- Conclusion: see for yourself the effect on the predicted 305-day production of the animals to the left and right of 110 days after calving. On average, the animals on the left, under the 15% understocking regime during the close-up period and 0% overstocking after calving, are projected almost 380 kg per lactation higher.
- We ourselves consider this chart the most educational one we saw this year, because it puts an end to endless and sometimes pointless discussions.
“This chart is the most educational one we saw this year.”
Why does 15% understocking during the close-up period play such a crucial role in higher 305-day production, given that feed intake in this period is not (yet) directly linked to lactation production? The next 2 charts provide the answer:
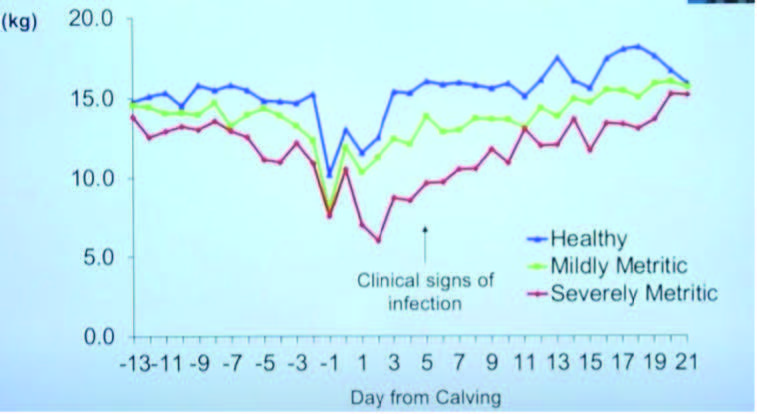
In the image above (chart no. 5), the vertical axis (y-axis) shows DM intake in kg. The horizontal axis (x-axis) shows the number of days before/after calving, from 13 days before calving up to and including 21 days after calving.
Within the chart area, cows without metritis (inflammation of the uterine wall) are shown by the blue line. Green shows animals with a mild form of metritis. Red shows animals with a severe form. It is therefore more than clear that animals with mild and severe inflammation also undeniably had lower DM intake during the close-up period under an overstocking regime.
The icing on the cake comes in the next chart, which shows the after-effects that overstocking during the close-up period can cause.
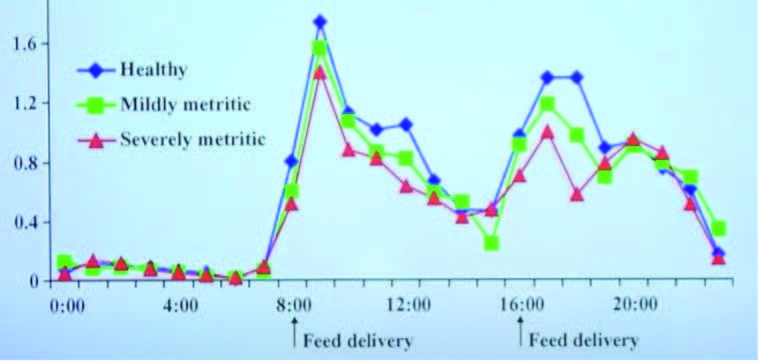
In the image above (chart no. 5), the vertical axis (y-axis) shows DM intake in kg. The horizontal axis (x-axis) shows the number of days before/after calving, from 13 days before calving up to and including 21 days after calving.
Conclusion: applying overstocking management during the close-up period (14 days before calving) inevitably induces too low DM intake during the post-fresh period. In effect, the negative intake behavior from the close-up period is copied into the period after calving, resulting in health problems and considerable production losses. Also worth mentioning is that there is a positive correlation between the lower DM intake and the water intake of fresh cows, which further increases the production loss.
Our conclusion: in our view, overstocking does not fit within a vision of healthy and economically sound long-term management. The pain point in the Netherlands and Flanders is that there are no benchmarks for 0% overstocking, because almost every farm has traditionally overstocked. Is it an ingrained management practice that has crept in out of habit or based on incorrect assumptions?
“In our view, overstocking does not fit within a vision of healthy and economically sound long-term management.”
The drive to maximize margins certainly plays a part. The question is whether we actually achieve this with overstocking. And let's not forget that within a few years, upcoming legislation will require 0% overstocking.
“The use of AI (artificial intelligence) gives us enormous insights into this.”
What we have not discussed in this update is the effect of overstocking on labor efficiency on an AMS farm or in conventional parlor management. We will come back to this in detail in our next update. Believe me, this will also make you sit back for a moment. The use of AI (artificial intelligence) gives us enormous insights into this. This will also be the theme of our management course in 2025. We will put our finger on the importance of barn layout for AMS efficiency in renovation and new-build projects (switching to or expanding AMS). We will also tell you more about this in our next update and newsletter.
Good luck, and see you soon,
Filip Jamart | XL-PRO Milking.